scdtb Raw Data Plot Part 2
Building More Raw Data Plots with scdtb
In scd Raw Data Plot Part 1 we discussed how to use the scdtb shiny app to build some of the single case design plots presented in WWC 5.0. This blog post will build upon part 1 by going over two plots from Small Sample Size Solutions.
Fictional Single Case Design Efficacy of CBT Example
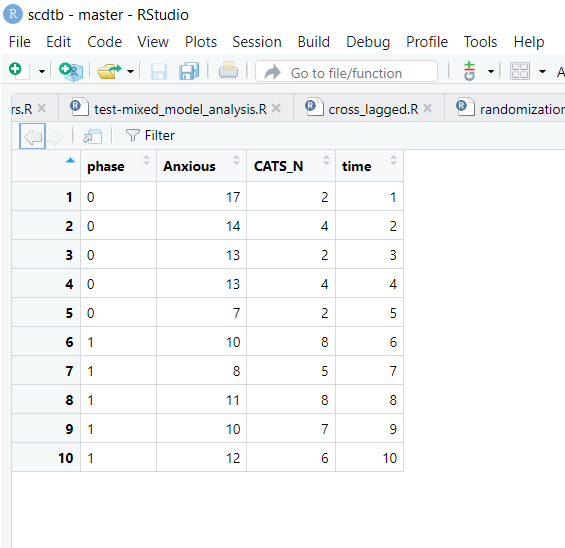
This example is take from Marija Maric and Vera van der Werff's Single-Case Experimental Designs in Clinical Intervention Research. The data is available as the efficacy_of_CBT dataset in the scdtb R package. View data in R below and then download the csv if you wish to follow along.
To plot this data, open the scdtb app by going to mightymetrika.com > Tools > scdtb. With the app open:
- click BROWSE...
- Navigate to find efficacy_of_CBT.csv on your computer
- Click on the file
- Click Open
After completing these steps you should see the following screen:
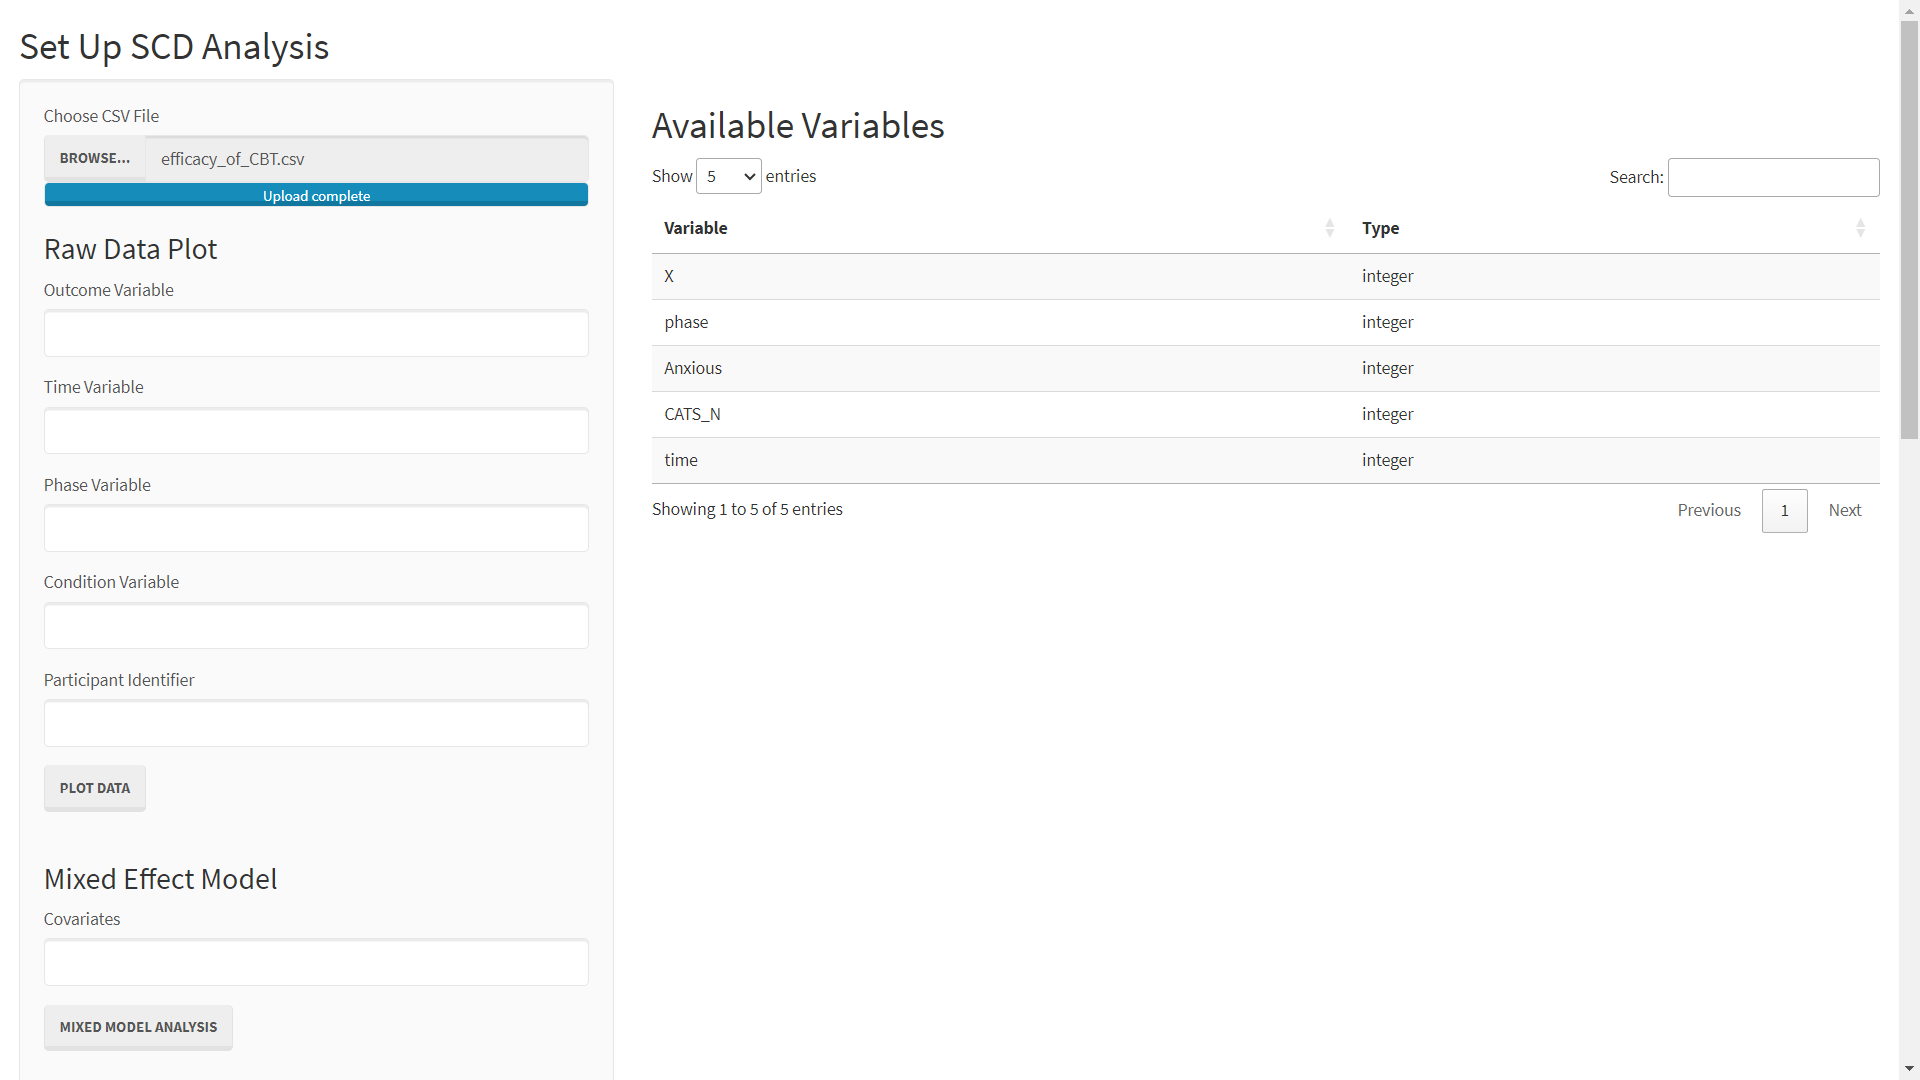
For this example, we will use Anxious as the outcome of interest. As such, we can plot this data by:
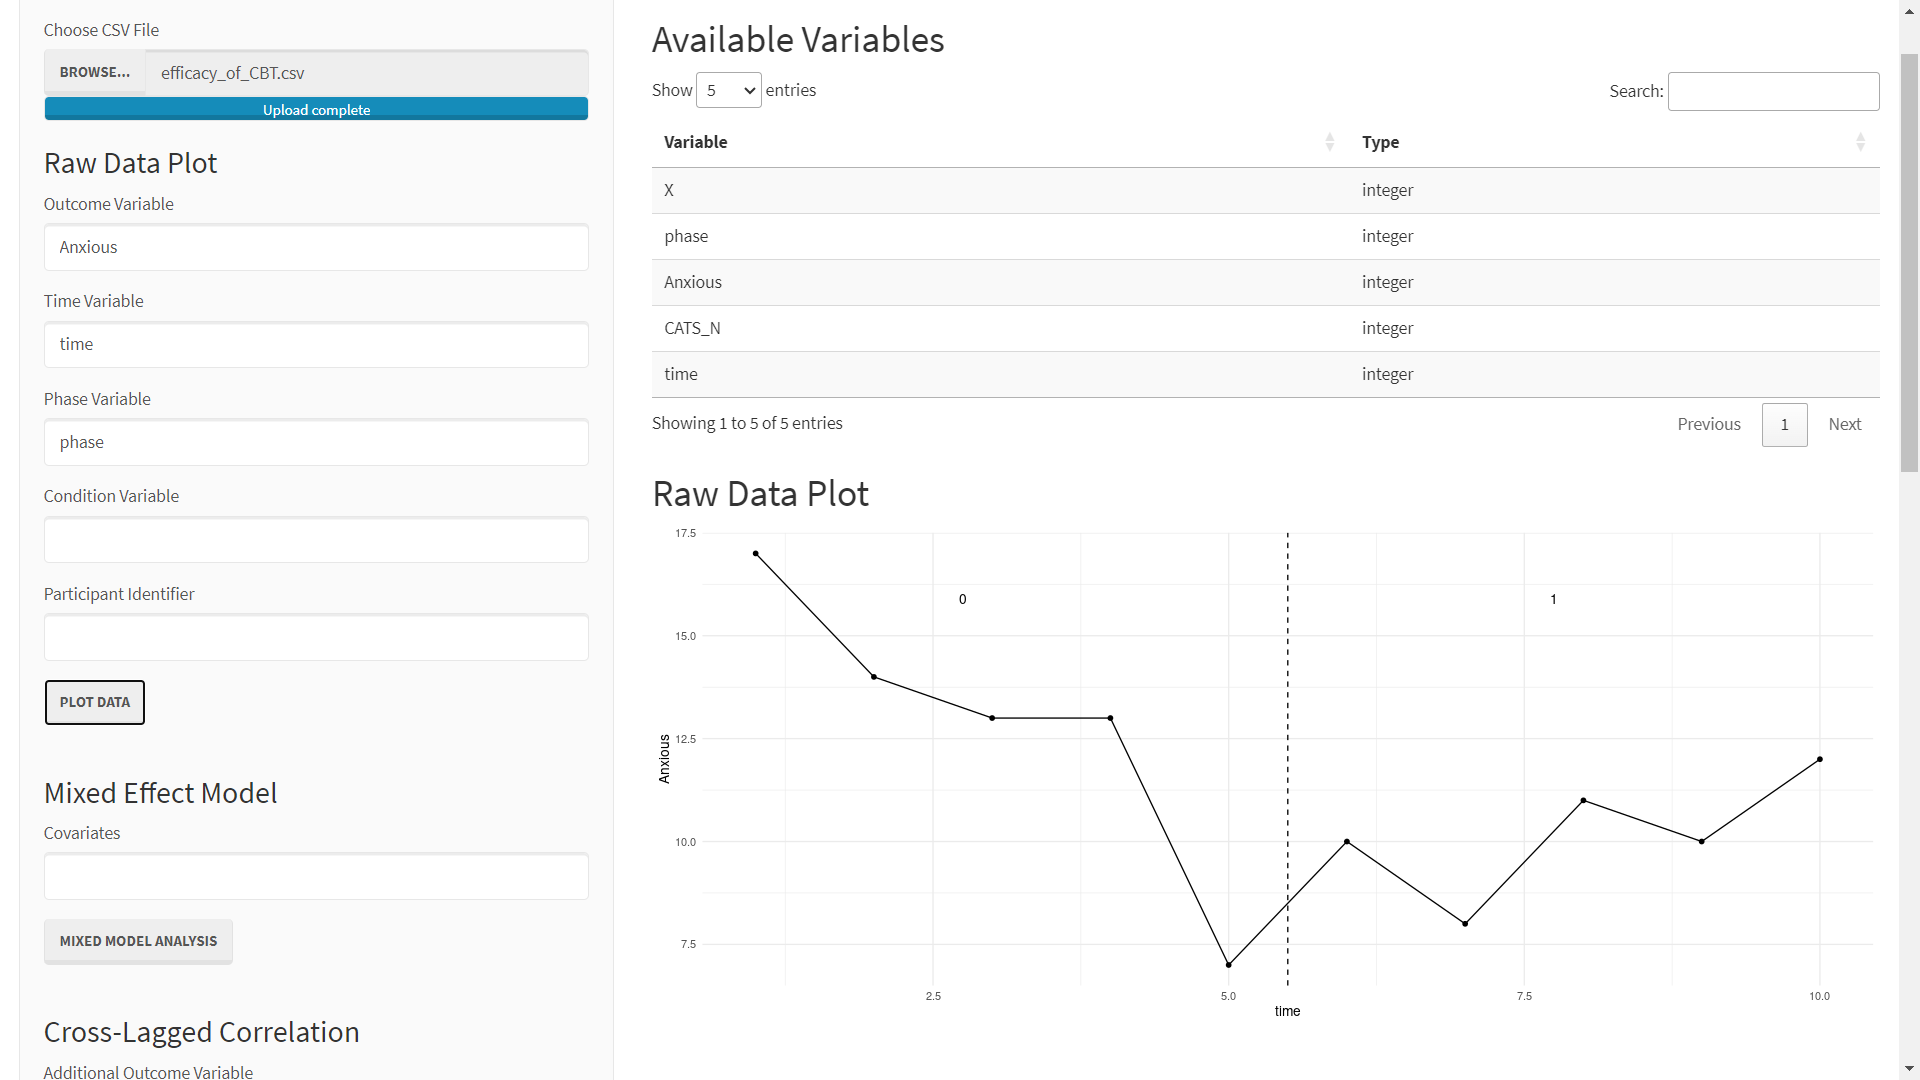
- Enter Anxious as the Outcome Variable
- Enter time as the Time Variable
- Enter phase as the Phase Variable
- Click PLOT DATA
After completing these steps you should see the following screen:
Sleeping Pills and Dizziness Example
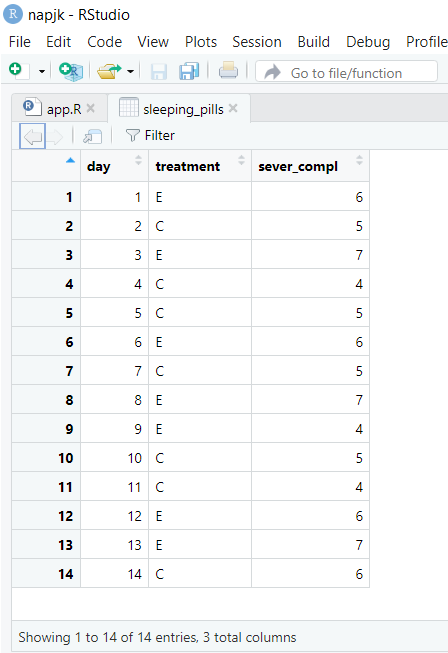
The next example is from Onghena's One by one: The design and analysis of replicated randomized single-case experiments. You can view this data as the sleeping_pills dataset in scdtb. Download the data below if you wish to follow-along.
As before, you can begin to plot this data by opening the scdtb app and uploading the data.
Open the scdtb app:
- Go to mightymetrika.com
- Click Tools
- Click scdtb
Once the app is open, upload the data by:
- clicking BROWSE...
- Navigating to find sleeping_pills.csv on your computer
- Click on the file
- Click Open
After completing these steps you should see the following screen:
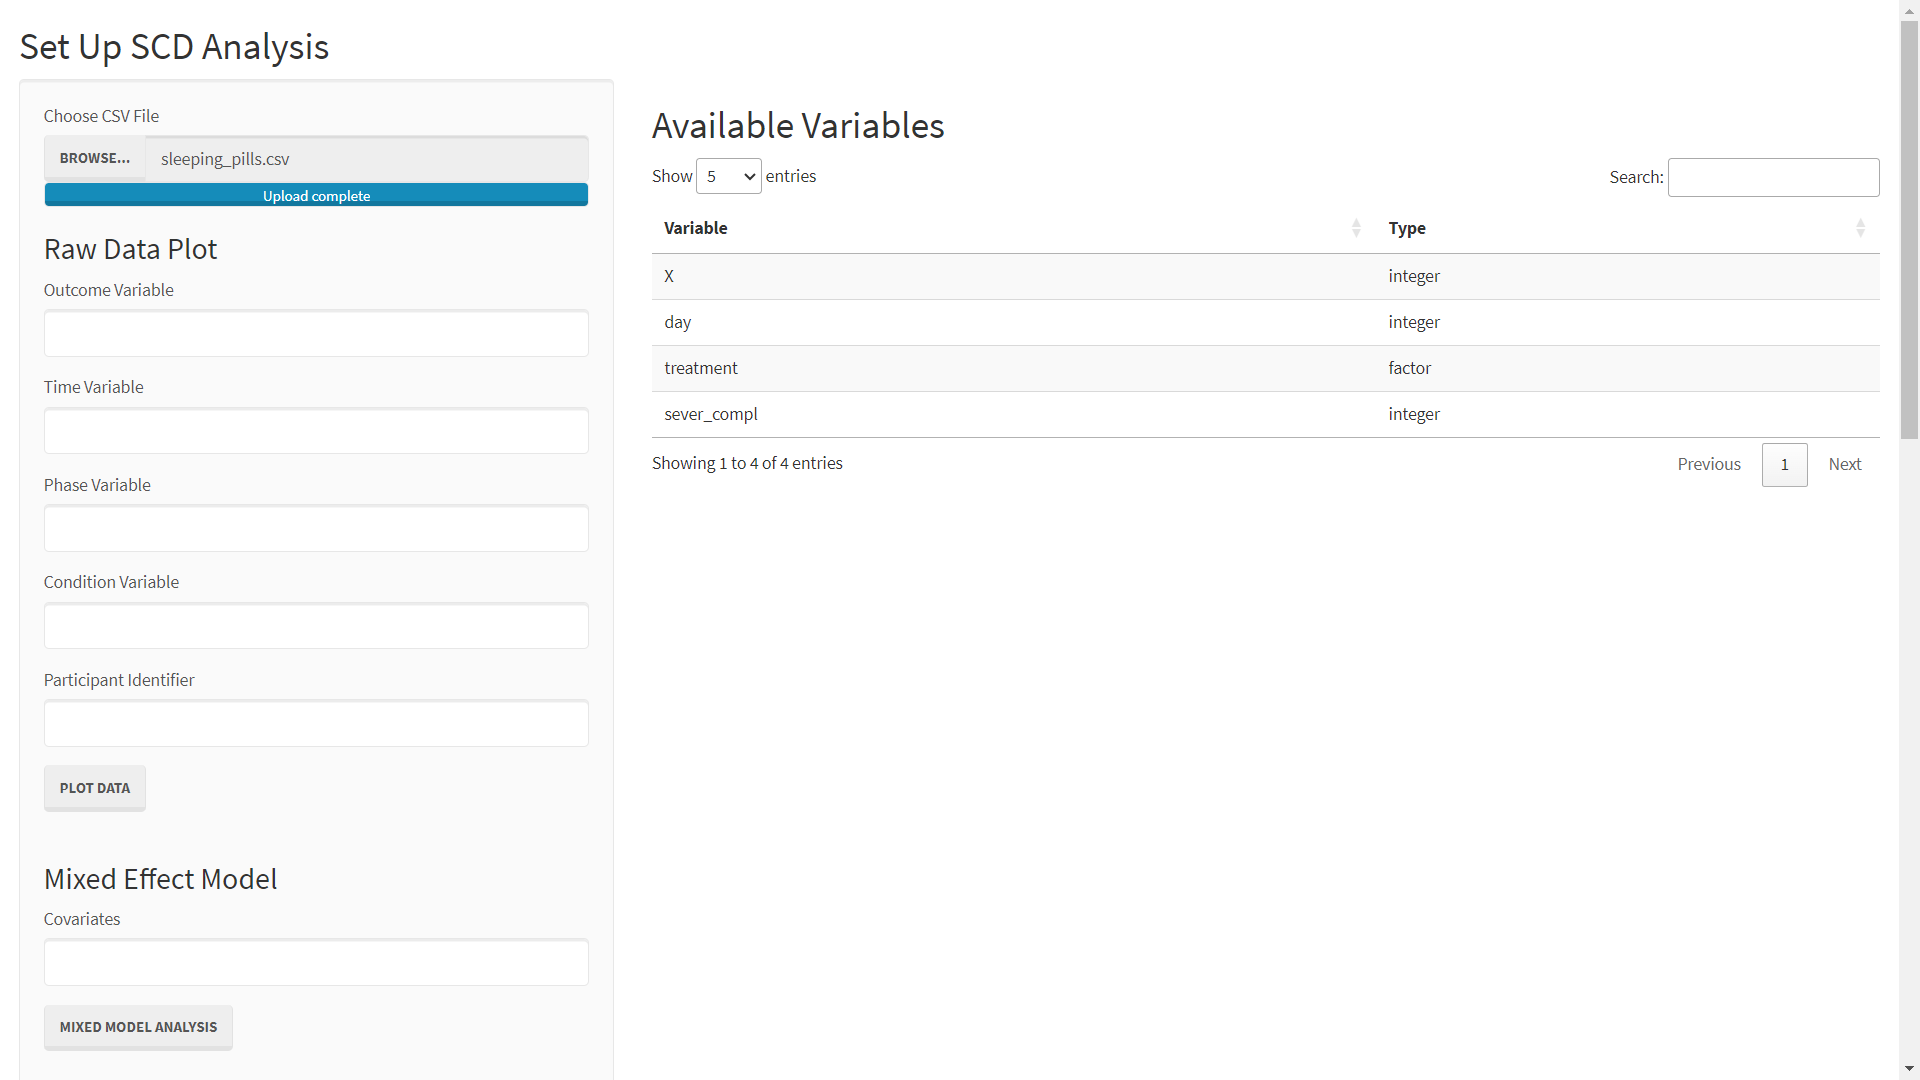
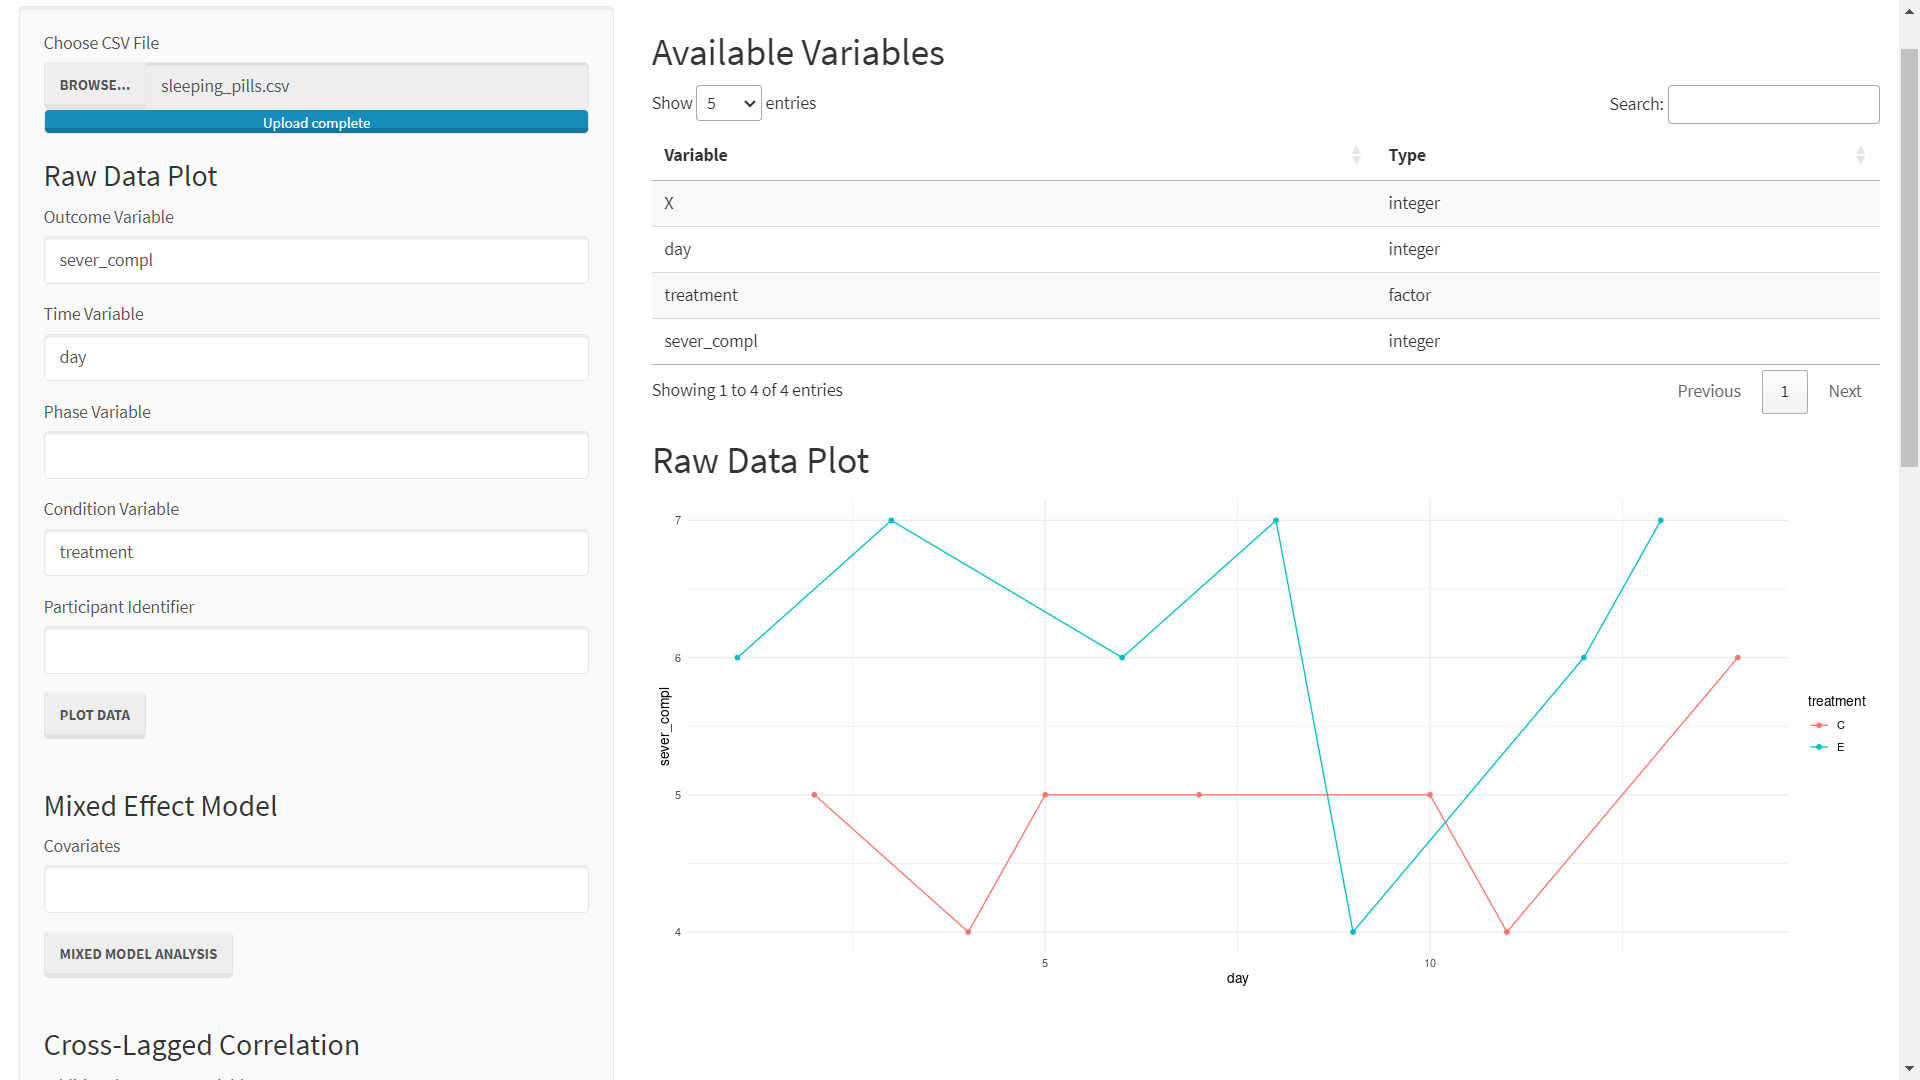
Instead of breaking observations up into successive phases as in the previous examples, this data set breaks the observations up into a randomly assigned experimental or control condition. As such, this plot will specify treatment as a Condition Variable.
To plot this data:
- Enter sever_compl as the Outcome Variable
- Enter day as the Time Variable
- Enter treatment as the Condition Variable
- Click PLOT DATA